How Do I Read the Fort Wayne Water Quality Report?
How do you read the Fort Wayne water quality report? Start with the page 4 table: compare each row's highest level detected with its MCL, MRDL or action level, then check the "Compliance Achieved" column, which reads "Yes" on every 2025 row.
Answered by the Three Rivers Home Water desk · Last updated

In this answer
The short version
- City Utilities publishes the Fort Wayne water quality report each June; the 2026 edition covers 2025 data in 6 pages, with Spanish and Burmese versions.
- Federal rules (40 CFR 141.153) require the report to define MCL and MCLG, and MRDL, action level and treatment technique when it uses them.
- Every regulated row in the 2025 table shows "Compliance Achieved: Yes".
- Lead is reported as a 90th percentile per sampling round: 4.26 ppb (January–June, 3 of 106 homes over 15 ppb) and 2.61 ppb (July–December, 0 of 101).
- TTHM and HAA5 show the highest locational running annual average across 12 sites: 22.5 ppb against 80, and 18.4 ppb against 60.
- Units are ppm (equal to mg/L) and ppb (equal to µg/L); one ppm is 1,000 ppb.
What is in the Fort Wayne water quality report?
The Fort Wayne water quality report is a 6-page yearly summary of where the city's water comes from, how it is treated and what testing found in the previous calendar year. City Utilities, which runs the Three Rivers Filtration Plant, writes and publishes it. This site has no tie to the utility; it only walks through what the report prints.
In the 2026 edition (2025 data), the pages break down roughly like this: page 1 is a letter and award news, page 2 covers lead, UV treatment and Cryptosporidium, page 3 has the PFAS box, page 4 holds the water quality table, page 5 discusses hardness, taste and health notes, and page 6 describes the St. Joseph River source and the state's source water assessment.
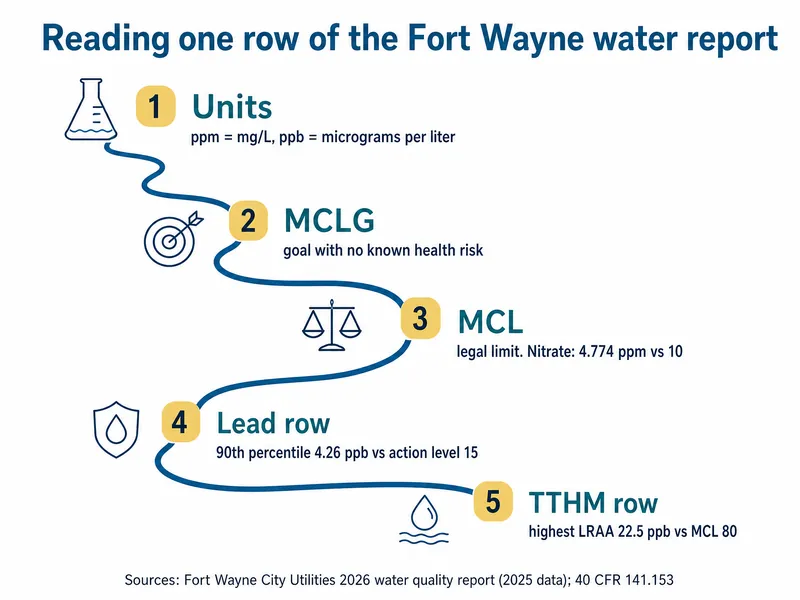
The table on page 4 is the part most people need. Each row is one substance, with columns for units, MCLG, MCL, "Compliance Achieved", highest level detected, range and typical sources. Reading a row means comparing the detected number with the limit in the same units.
2025 results from the page 4 table
- 4.26 ppbLead 90th percentile, January–June 2025 (action level 15)Source: City Utilities 2026 water quality report
- 4.774 ppmHighest nitrate result (MCL 10)Source: City Utilities 2026 water quality report
- 22.5 ppbHighest TTHM running average of 12 sites (MCL 80)Source: City Utilities 2026 water quality report
- 2.10 ppmHighest chlorine level (MRDL 4)Source: City Utilities 2026 water quality report
What do MCL, MCLG and MRDL mean?
The MCL is the legal limit, the MCLG is the health goal, and the MRDL is the limit for a disinfectant. The federal report rule, 40 CFR 141.153, spells out each definition that every report has to print:
- MCLG (maximum contaminant level goal): "The level of a contaminant in drinking water below which there is no known or expected risk to health." It is a goal, not an enforceable limit.
- MCL (maximum contaminant level): "The highest level of a contaminant that is allowed in drinking water", set as close to the MCLG as treatment allows.
- MRDL and MRDLG: the same pair for disinfectants such as chlorine. The MRDL is "the highest level of a disinfectant allowed in drinking water".
- Action level: the concentration that, if exceeded, "triggers treatment or other requirements". Lead and copper use this instead of an MCL.
- Treatment technique (TT): "a required process intended to reduce the level of a contaminant", used for turbidity, total organic carbon and Cryptosporidium.
Where the MCLG is 0, as it is for lead and E. coli, a detection above zero is not a violation; the MCL or action level is the line that counts. For example, nitrate's highest 2025 result was 4.774 ppm against an MCL of 10 ppm, and fluoride was 0.85 ppm against 4 ppm.
How do you read the lead rows?
Read the lead rows as a 90th percentile per six-month round, plus a count of homes over the action level. City Utilities tests tap samples at selected homes twice a year, and the report gives one row for each round.
For 2025, January–June: 90th percentile 4.26 ppb, range 0–23.7 ppb, 106 samples, 3 above the 15 ppb action level. July–December: 90th percentile 2.61 ppb, range 0–7.53 ppb, 101 samples, none above. The 90th percentile means 9 in 10 sampled homes were at or below that number. A system is in compliance as long as the 90th percentile stays at or under 15 ppb, which is why both rounds read "Yes" even though three homes in the first round were higher.
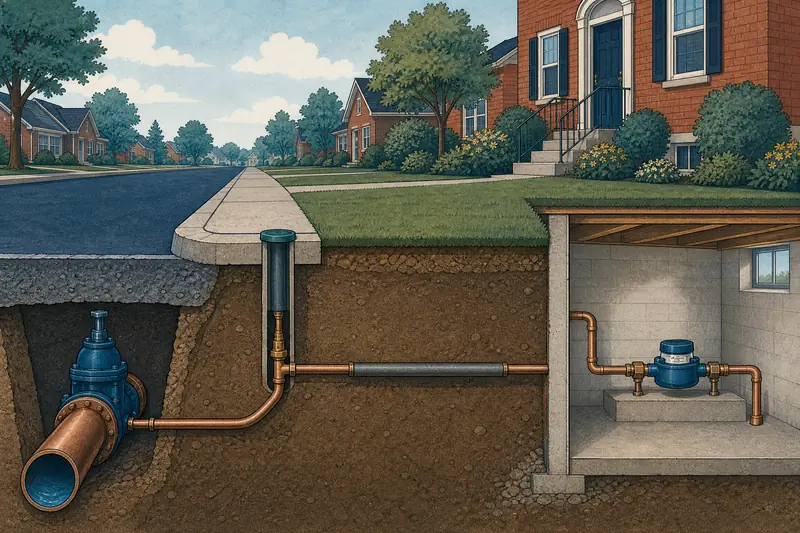
The action level is 15 µg/L today. EPA's Lead and Copper Rule Improvements lower it to 10 µg/L on November 1, 2027 and require lead service lines to be replaced within 10 years. The plant's water is lead-free; lead comes from private service lines and household plumbing, so check whether your house has a lead service line and see how the city's replacement program works.
| Row | Highest level or 90th percentile | Limit | What the limit is |
|---|---|---|---|
| Lead, Jan–Jun 2025 | 4.26 ppb (3 of 106 over 15) | 15 ppb | Action level |
| Lead, Jul–Dec 2025 | 2.61 ppb (0 of 101 over 15) | 15 ppb | Action level |
| Copper, Jan–Jun 2025 | 0.0549 ppm | 1.3 ppm | Action level |
| Nitrate (as nitrogen) | 4.774 ppm | 10 ppm | MCL |
| TTHM | 22.5 ppb (highest LRAA) | 80 ppb | MCL |
| HAA5 | 18.4 ppb (highest LRAA) | 60 ppb | MCL |
| Chlorine | 2.10 ppm | 4 ppm | MRDL |
| Chlorine dioxide | 228 ppb | 800 ppb | MRDL |
| Atrazine | 0.39 ppb | 3 ppb | MCL |
What do TTHM and HAA5 rows mean?
TTHM (total trihalomethanes) and HAA5 (five haloacetic acids) are byproducts that form when chlorine reacts with natural organic matter in river water, and their rows show a running average, not a single sample. The number printed is the highest locational running annual average (LRAA), which federal rules define in 40 CFR 141.2 as the average of samples at one monitoring site over the previous four calendar quarters.
In 2025, City Utilities sampled 12 sites. The worst site's running average was 22.5 ppb for TTHM (MCL 80) and 18.4 ppb for HAA5 (MCL 60). The ranges, 5.7–46.3 ppb and 8.6–34.0 ppb, are individual results; a single result above the average is expected, and compliance is judged on the running average.
Chlorite (0.77 ppm against an MCL of 1) is a related byproduct of chlorine dioxide, the second disinfectant Fort Wayne uses. If those rows interest you because you dislike the chlorine taste, the chlorine filter question covers the options.
What does the report say about unregulated compounds?
Unregulated rows list substances with no federal limit, so there is no MCL to compare against and no "Compliance Achieved" answer. In the 2026 report these include sodium (highest 54 ppm), nickel, the herbicide metolachlor (average 0.24 ppb) and total hardness (average 130 mg/L, range 94–174), which is why hardness sits in the table at all; is Fort Wayne water hard explains that number.
The UCMR5 rows are EPA's nationwide survey of unregulated contaminants, sampled in Fort Wayne in June, September and December 2023 and March 2024. Two PFAS turned up: PFHxA averaging 0.0017 ppb (1.7 parts per trillion) and PFPeA averaging 0.0057 ppb (5.7 ppt). Neither has an MCL. The report's page 3 box says City Utilities has not detected any of the six PFAS regulated in 2024 (PFOA, PFOS, PFNA, PFHxS, PFBS and HFPO-DA); is there PFAS in Fort Wayne water compares that with EPA's limits.

Where do you find the Fort Wayne water quality report?
You find the current and past Fort Wayne water quality reports on City Utilities' water quality report page, which lists each year's report back to the 2018 data year, with Spanish and Burmese versions for recent years. The 2025 data report was published in June 2026.
Federal rules require community water systems to deliver the report each year by July 1, according to EPA, and systems serving 50,000 or more people must post the current report online (40 CFR 141.155). If you are on New Haven, Huntertown or another Allen County system, your numbers come from that system's own report, not this one; where Fort Wayne tap water comes from lists the local systems.
How this answer was put together
This answer reads City Utilities' 2026 Annual Drinking Water Quality Report (2025 data, all 6 pages, with the page 4 table quoted row by row), the utility's water quality report page, the federal report rule (40 CFR 141.153 and 141.155) and the LRAA definition in 40 CFR 141.2 from eCFR, and EPA's consumer report and Lead and Copper Rule Improvements pages, all read in October 2026. Health-effect language for each contaminant was left out; the report's own health notes and EPA are the sources for that. pH and total dissolved solids are not in the report, so they are not discussed.
Follow-up questions
Why does the report say "highest level detected" instead of an average?
For most rows, the table shows the highest result or highest running average that counts for compliance, because that is the number regulators check. Hardness, metolachlor and the UCMR5 rows are labeled as averages instead, so read each row's label.
What does "NA" mean in the MCLG or MCL column?
It means no federal goal or limit exists for that row. Sodium, hardness and nickel show NA in the MCL column because they are unregulated.
Is a nitrate result of 4.774 ppm close to the limit?
It is under half of the 10 ppm MCL. Nitrate in river water rises with farm runoff, so the report shows a wide range, 0.117 to 4.774 ppm, across 2025.
Why are there two lead rows and two copper rows?
City Utilities sampled in two six-month rounds in 2025, and each round gets its own row with its own sample count. Read them separately; they are not added together.
Does the report test my own tap?
No. It reports plant water and selected compliance sample sites. For lead at your faucet, the report directs residents to a state-certified lab listed by the Indiana Department of Health.
What does the Cryptosporidium row mean?
The highest count in incoming river water was 0.242 oocysts per liter in 2025, and finished water had none. UV treatment, added in 2014 for $21 million, is the step aimed at it.
Where are the older Fort Wayne reports?
The same City Utilities page lists reports for each year back to the 2018 data year, and links to older reports. Comparing two years is a quick way to see what changed, such as hardness moving from 122 mg/L in 2024 to 130 mg/L in 2025.
More tap water questions
Have another question? See the full list of Fort Wayne home water questions.